| On source: |  |
| Off source: |  |
During the photometric measurements, we use chopping, i.e. a few frames are recorded while the telescope points to the target, then the telescope is moved to a piece of blank sky, a few frames are recorded, the telescope is moved back to the target, and so on. The images one obtains by averaging on- and off-source frames, respectively, look like this:
| On source: |  |
| Off source: |  |
You can see that you can't see anything. To make the object visible, we subtract the off-source image from the on-source image:

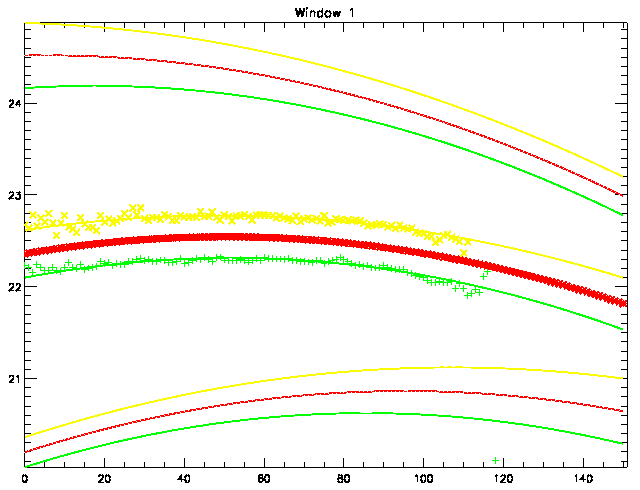
This is done by chop_nod_disp, which also measures the position and flux of the spectrum. The main program calls chop_nod_disp for each of the two photometry files, in order to find the position and flux of the spectrum in the images from both telescopes.

The position and width of the mask that is going to be used for the interferomtric data (red) is the mean of the positions and widths of the masks of the two photometric datasets (green and yellow). Note that this is not the mean of the masks itself, but the mean of the positions and widths!
The data is first "compressed" using the C-program oirCompressSpec. This program reads every frame, multiplies it by the mask, and adds up the pixels in y-direction. This means each two-dimensional frame is converted into a one-dimensional spectrum, hence the name "compression". All the additional information in the FITS table is left untouched.
The IDL program reads this compressed datafile and subtracts the two interferometric channels from each other, in order to get the fringe signal. The result is ordered into the separate OPD-scans that were done by the instrument during the observation. For display, the data is also integrated over the spectrum, so each frame is reduced to a single number. The dispersed data is kept, however, since we will need it for the final visibility as function of wavelength.

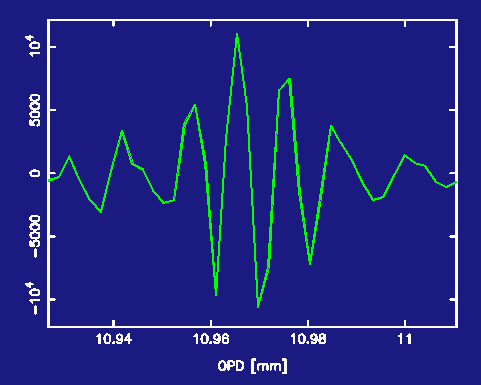
The image shows the fringe signal of one single scan (this is integrated over wavelength). This is a sine-wave multiplied by some envelope function, which is determined by the shape of the spectral sensitivity function of the instrument. The smaller the bandwidth, the wider the fringe packet, and vice versa. We want to find the amplitude of the sine wave, since that is the correlated flux we want to measure. To do this, we Fourier-transform the fringe signal.

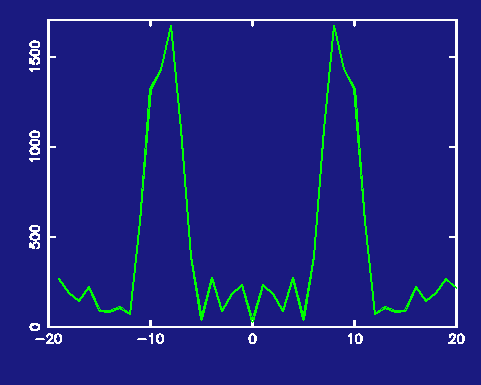
The (discrete) Fourier-transform can also be seen as writing the fringe signal as a sum of sine-waves with different amplitudes (coefficients). So all we have to do is pick the coefficient at the right frequency and we have our amplitude. However, since the incoming light was not monochromatic, our fringe is the sum (or rather the integral) of many sine-waves of different wavelength. This means, we have to add up the coefficients at several frequencies. Which frequencies depends on the central wavelength and bandwidth of the light.
The sum of those coefficients is the correlated flux, and correlated flux divided by the uncorrelated flux (i.e. what we measure when we do normal photometry) is the visibility.
You might have noticed that we ignored the fact that a Fourier-transform gives a complex result. We talked only about the amplitudes and neglected the phases. This is because the phases are neglected in MIA, all that is used is the square of the Fourier transform.