Previous: Photometry
Next: Algorithms
Spectroscopy with Chop_Nod_Disp
A similar routine exists for dispersed data. It is called
chop_nod_disp. To start it, e.g. for the
photometry of beam A, just type
chop_nod_disp,calfile[2]
Options
- WIDTH=w, width of 1D-gaussian relative to width of fit (by default 1.0)
- TRACE_ORDER=o, order of polynopmial used to fit position (by default 2)
- FWHM_ORDER=o, order of polynopmial used to fit FWHM (by default 1)
- BEFORE=b, number of frames to skip before chop (by default 1)
- AFTER=a, number of frames to skip after chop (by default 1)
- /SILENT , tells routine to be non interactive
- /REVERSE , flags for object and sky are reversed

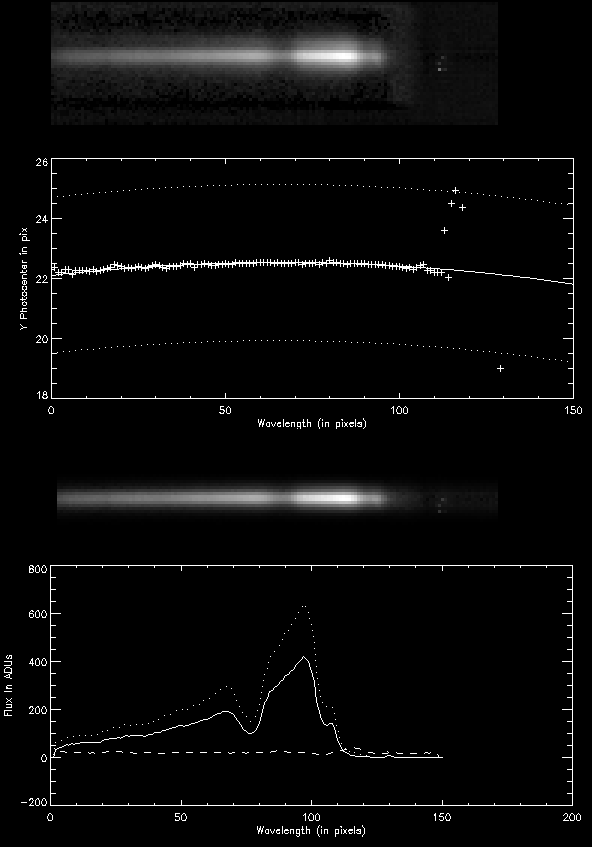
The image above is composed by combining the content of two IDL panels partially. It shows the graphical
output of chop_nod_disp for the interferometric beam I1 when it has been fed
only by beam A during the photometric measurement. The uppermost spectra is the "raw" spectrum
one gets when the chopped frames are subtracted. A few additional steps are needed to determine the
"real" spectrum:
- columnwise median smoothing to remove badpixels
- columnwise one-dimensional gaussian fit (centers = photocenters = crosses in first graph)
- fit to the photocenters (solid line): c(x) = 22.1029+0.0130640x-9.98348e-5x^2.
- fit to the FWHMs of the gaussians (dotted lines): s(x) = +/- 2.20357+0.000111095x
- creation of a gaussian mask by using for each column x the fitted center c(x), the fitted FWHM s(x), and the
user-specified WIDTH
- linear fit of the background for each column (integrated background plotted as dotted line in the last graph)
- subtraction of the background
- weighting of the remaining spectrum with the mask (see image above)
- columnwise integration of the weighted flux (solid line in the last graph)
The spectrum is written to an ascii file within the newly created subfolder
'<path>/PHOTOMETRY'
Previous: Photometry
Next: Algorithms
Rainer Köhler & Thorsten Ratzka

