: Simulation Results : Numerical simulations : Introduction 目次
The simulations utilised a wind-scatter model of the atmosphere (see
e.g. [10]) using two Taylor screens of frozen Kolmogorov
turbulence with large (![]() ) outer scale. Fluctuations in air
and water vapour spectral dispersion were not modelled, and the Taylor
screens introduced equal fluctuations in the wavefront delay at all
wavelengths.
) outer scale. Fluctuations in air
and water vapour spectral dispersion were not modelled, and the Taylor
screens introduced equal fluctuations in the wavefront delay at all
wavelengths.
In the simulations, the Taylor screens were blown past the simulated
telescopes at constant wind velocities. The timescale for changes in
the light intensity measured with a large diameter telescope is
proportional to the parameter
![]() (see
[10,11]) where
(see
[10,11]) where ![]() is the standard deviation of
the distribution of the wind velocities for the screens, weighted by
the turbulence
is the standard deviation of
the distribution of the wind velocities for the screens, weighted by
the turbulence ![]() for each screen:
for each screen:
The Taylor screens were moved across the telescope aperture at the
appropriate wind speeds along one axis of the rectangular Taylor
screen array. A section of each Taylor screen was extracted at each
time point and then rotated according to the wind direction angle and
re-sampled to have at least twice as many pixels per ![]() using
linear interpolation to minimise pixel aliasing. The resulting screens
were summed and converted to complex wavefronts at a range of
different wavelengths. After truncating the wavefronts with a circular
telescope aperture, an image plane representation of the wavefronts
was generated at each wavelength using an FFT. The atmospheric model
used throughout this documents had two Taylor screens of equal
strength moving at equal wind speed with wind angles differing by
using
linear interpolation to minimise pixel aliasing. The resulting screens
were summed and converted to complex wavefronts at a range of
different wavelengths. After truncating the wavefronts with a circular
telescope aperture, an image plane representation of the wavefronts
was generated at each wavelength using an FFT. The atmospheric model
used throughout this documents had two Taylor screens of equal
strength moving at equal wind speed with wind angles differing by
![]() . The time unit used when describing the simulations
corresponds to the time taken for each of the Taylor screens to move
by the coherence length
. The time unit used when describing the simulations
corresponds to the time taken for each of the Taylor screens to move
by the coherence length ![]() for the wavefronts in the telescope
aperture plane (after the wavefronts had been perturbed by both
atmospheric layers).
for the wavefronts in the telescope
aperture plane (after the wavefronts had been perturbed by both
atmospheric layers).
Seven discrete wavelength channels were simulated, with equal spacings
in wavelength between
![]() and
and
![]() . The correlated fluxes in the seven wavelength
channels were then linearly combined to give three channels with
wavelengths and bandpasses approximately matching the channels on the
real PRIMA FSUs.
. The correlated fluxes in the seven wavelength
channels were then linearly combined to give three channels with
wavelengths and bandpasses approximately matching the channels on the
real PRIMA FSUs.
In some of the simulations, bulk atmospheric refraction and/or
scintillation were also modelled. For these studies one of the Taylor
screens was assigned an altitude of ![]() above the telescope
and the other
above the telescope
and the other ![]() . For refraction studies Snell's law was
used to model the variation of the light ray position and tilt with
wavelength and altitude, ensuring that the correct part of each Taylor
screen was used for each wavelength channel. This was calculated using
the approach introduced in Section 2.2.7.
. For refraction studies Snell's law was
used to model the variation of the light ray position and tilt with
wavelength and altitude, ensuring that the correct part of each Taylor
screen was used for each wavelength channel. This was calculated using
the approach introduced in Section 2.2.7.
The fluctuation in delay induced by the atmospheric turbulence
(
![]() from Equation 17) has only
a small direct dependence on wavelength
from Equation 17) has only
a small direct dependence on wavelength ![]() (due to dispersion),
so the induced phase rotation is well approximated across the K band
by:
(due to dispersion),
so the induced phase rotation is well approximated across the K band
by:
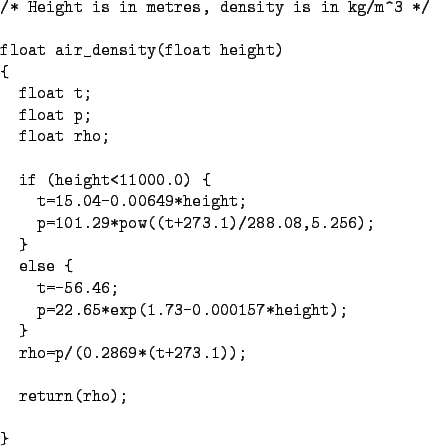
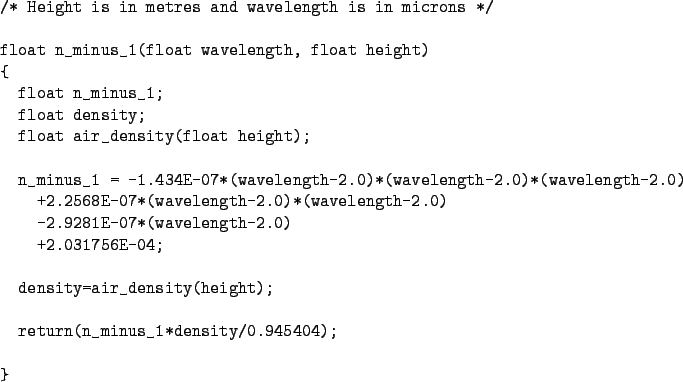
For the simulations, the air density as a function of altitude was
based on the Glenn Research Center's Earth Atmosphere Model,
and the refractive index was calculated from the density using a cubic
spline fit to K-band data from [12]. The algorithms used
are presented in Figures 2 and
3. The optical ray displacement was calculated
and integrated at ![]() intervals through the atmosphere -
Richard Mathar has recently started work on an improved model for the
optical path through the atmosphere.
intervals through the atmosphere -
Richard Mathar has recently started work on an improved model for the
optical path through the atmosphere.
 |
 |
For the scintillation studies a first-order approximation to the
optical propagation was performed. The effect of each Taylor screen
was investigated independently, with the amplitude fluctuation
(
![]() from
Equation 2) in the AT aperture plane
estimated by applying phase changes in the conjugate plane to re-image
the Taylor screen to the appropriate altitude. The amplitude
fluctuations from the two Taylor screens were then combined
multiplicatively without taking account of any second-order terms
resulting from the interaction of the wavefront fluctuations induced
by the two Taylor screens. The phase changes resulting from optical
propagation from the turbulent layers to the telescopes were also
ignored.
from
Equation 2) in the AT aperture plane
estimated by applying phase changes in the conjugate plane to re-image
the Taylor screen to the appropriate altitude. The amplitude
fluctuations from the two Taylor screens were then combined
multiplicatively without taking account of any second-order terms
resulting from the interaction of the wavefront fluctuations induced
by the two Taylor screens. The phase changes resulting from optical
propagation from the turbulent layers to the telescopes were also
ignored.
The spatial sampling of the electric field was kept constant in the image plane for all the simulations which necessarily required wavelength-dependent spatial sampling in the pupil plane.
Robert Tubbs 平成16年11月18日
![\begin{displaymath}
\Delta v = \left [ \frac{ \int_{0}^{\infty} \left \vert \mat...
... \left ( h \right ) \mbox{d}h} \right \vert^{2} \right ]^{1/2}
\end{displaymath}](img93.png)