
| Name | Telescope | Ra (J2000) | Dec (J2000) | Filter | λeff | FWHM | Depth (AB) | Size |
|---|---|---|---|---|---|---|---|---|
| HDF-S-F110W | HST | 22:32:51.75 | -60:38:48.20 | F110W | 1.100μm | 0.600μm | 27.75 | 2704.0''2 |
| HDF-S-F160W | HST | 22:32:51.75 | -60:38:48.20 | F160W | 1.500μm | 0.800μm | 27.55 | 2704.0''2 |
| HDF-S-F222M | HST | 22:32:51.75 | -60:38:48.20 | F222M | 2.300μm | 0.130μm | 24.75 | 2704.0''2 |
| HDF-S-ACTA-1.4GHz | ACTA | 22:33:25.96 | -60:38:09.0 | 1.4GHz | 21.4 cm | 0.8 cm | 19.55 | 34.0'2 |
| HDF-S-ACTA-2.5GHz | ACTA | 22:33:25.96 | -60:38:09.0 | 2.5GHz | 12.0 cm | 0.2 cm | 19.61 | 34.0'2 |
| HDF-S-ACTA-5.2GHz | ACTA | 22:32:56.22 | -60:33:02.7 | 5.2GHz | 5.8 cm | 0.1 cm | 19.92 | 34.0'2 |
| HDF-S-ACTA-8.7GHz | ACTA | 22:32:56.22 | -60:33:02.7 | 8.7GHz | 3.4 cm | 0.0 cm | 19.55 | 34.0'2 |
| HDF-S-F110W | HST | 22:32:51.75 | -60:38:48.20 | F110W | 1.100μm | 0.600μm | 27.75 | 2704.0''2 |
| HDF-S-F160W | HST | 22:32:51.75 | -60:38:48.20 | F160W | 1.500μm | 0.800μm | 27.55 | 2704.0''2 |
| HDF-S-F222M | HST | 22:32:51.75 | -60:38:48.20 | F222M | 2.300μm | 0.130μm | 24.75 | 2704.0''2 |
The following image illustrates the depth of the observations going into this collection.
You can also download a text file with the data going into this plot by clicking on this link.
The dust maps for this field has been extracted from the Schlegel, Finkbeiner & Davis (1998) dust maps using the interface provided by IPAC.
The individual fields listed above have been overplotted - note that the detailed shape of the field is not stored and position angles are also not kept so the image should only be viewed as indicative. The FITS file with detailed information is also available for download.
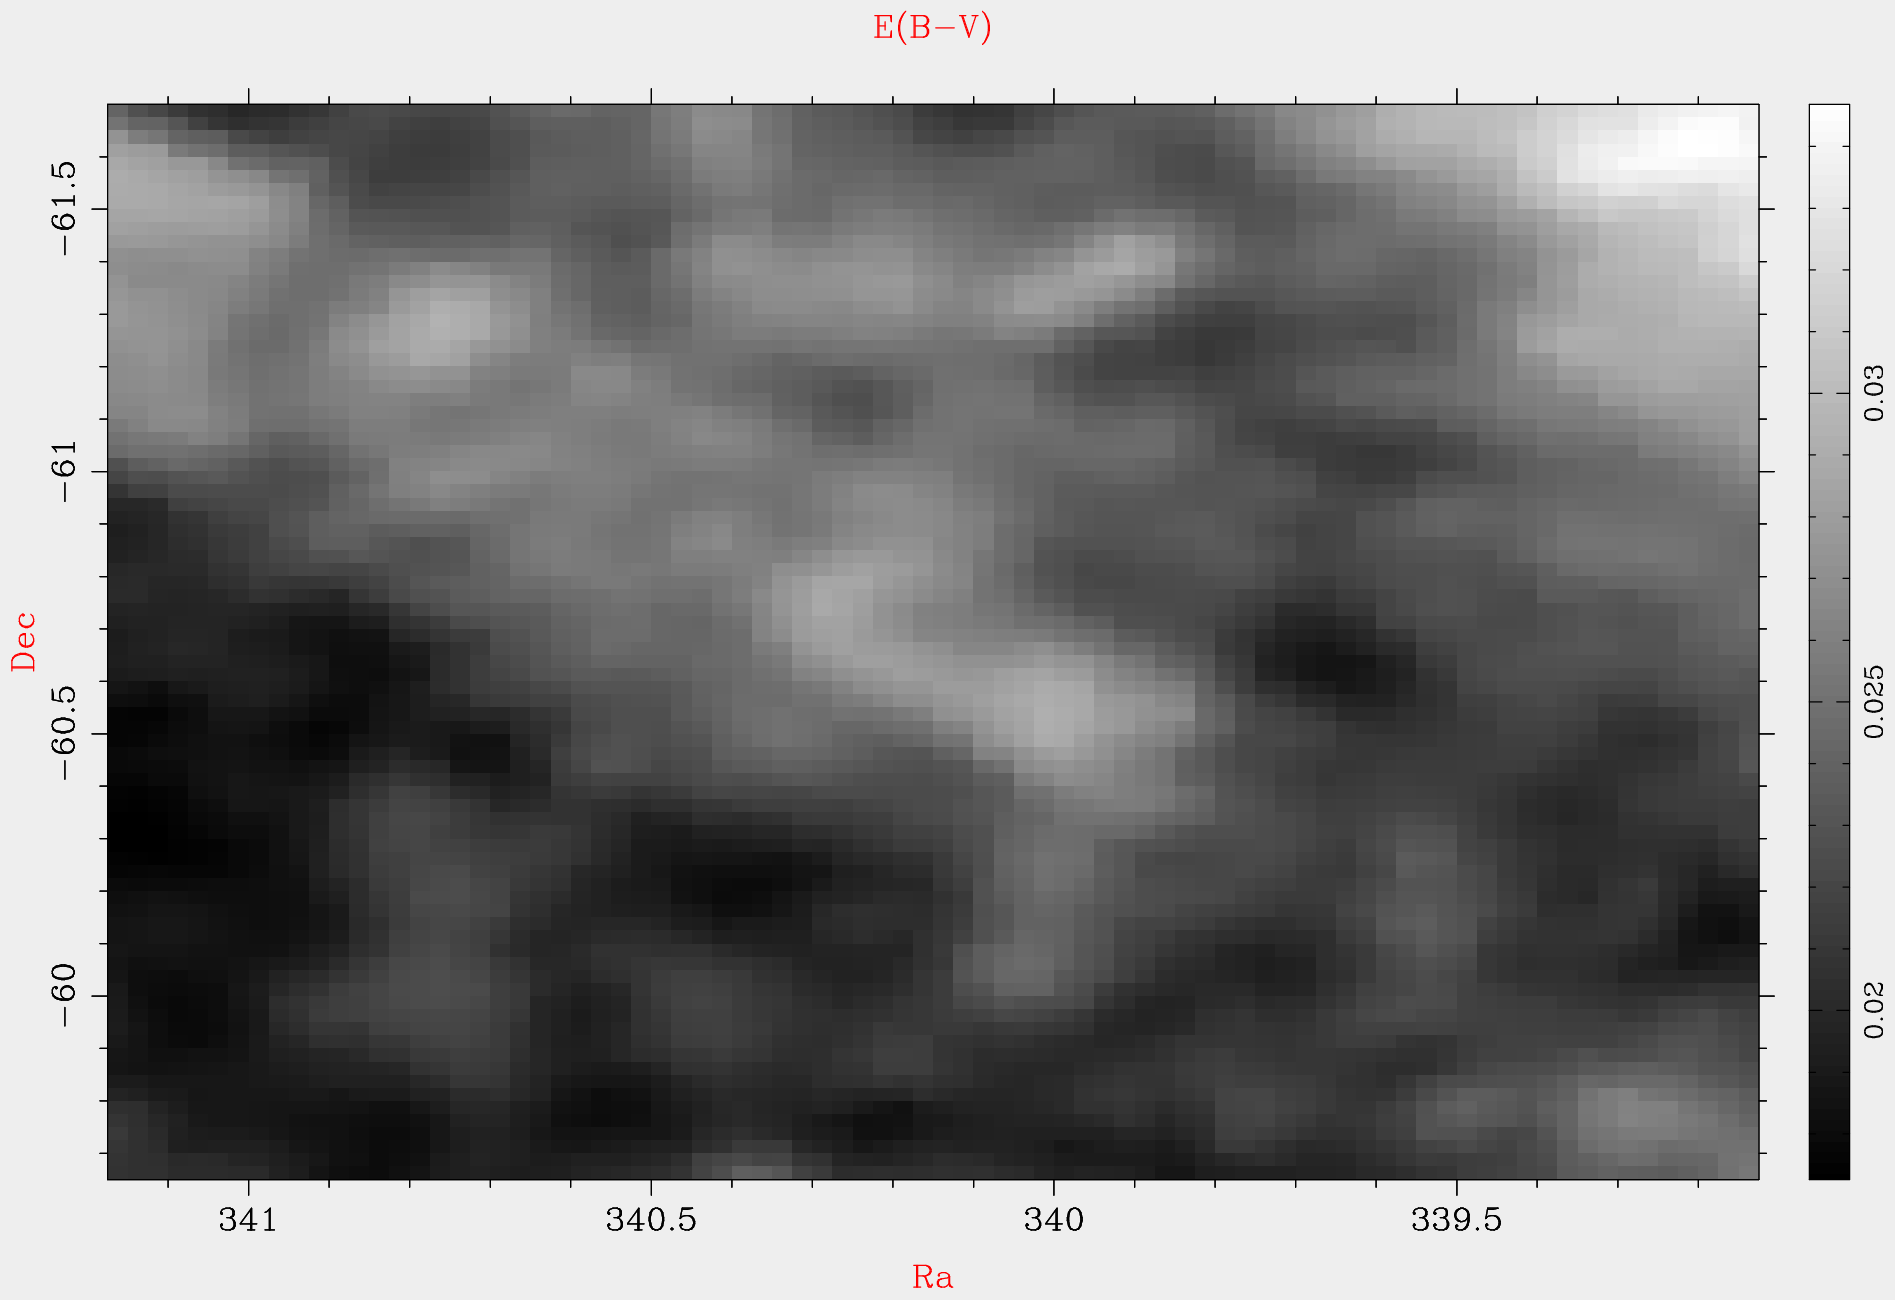
Minimum E(B-V)=0.02. Maximum E(B-V)=0.03. Average E(B-V)=0.02 and Median E(B-V)=0.02