allegroUtils API
Project Manager
- allegroUtils.projectManager.all_users(optOut=False, visitors=True, strw=True)[source]
returns a list with the emails of all users with directories in /lustre/* or /lustre/allegro/home/*
Parameters:
- allegroUtils.projectManager.dir_usage(directory, du='-sbh')[source]
checks the directory size with the shell command ‘du’
Parameters: Returns: direcotry size (human readable)
- allegroUtils.projectManager.get_email(user)[source]
returns the email of a user. It distinguishes between STRW members and Allegro visitors.
Parameters: user (str) – username Returns: email Return type: str
- allegroUtils.projectManager.get_firstname(user)[source]
returns the first name of the user (if the user is a STRW member, otherwise simply an ‘Allegro user’ is returned
- allegroUtils.projectManager.hd_usage(directory)[source]
returns the HD usage of the disk that hosts directory
Parameters: directory (str) – directory to check HD usage on Returns: tuple with total, free, used memory
- allegroUtils.projectManager.permission(rwx)[source]
converts a permission in ‘rwxrwxrwx’ format to a python stat-flag.
Parameters: rwx (str) – permission string Returns: stat-flag
- class allegroUtils.projectManager.projects(admin=False, allegro=None, allegroStaff=None, allegroDB=None, dirDBProjects=None, dirDBVisitors=None, dirDBProjectsArchive=None, dirDBPublicDatasets=None, dirDBf2f=None, dirDBqa2=None, dirHome=None, dirProjects=None, dirProjectsArchive=None, dirProjectsCurrent=None, dirMailMessages=None, dirPublicDatasets=None, DBNewsletter=None, DBUserNames=None, ims_tf=False)[source]
The class “project” manages all kinds of project things. You can create a new project, you can link/unlink users, you can attach data. For this class, some directories are defined:
Database:
- self.dirDBProjects: database directory with projects
- self.dirDBProjectsArchive: database directory with archived projects
- self.dirDBVisitors: database directory with current Allegro visitors
- self.dirDBPublicDatasets: database directory with the public data
- self.dirDBf2f: database directory with the face-to-face visits
- self.dirDBqa2: database directory with the qa2 archive
User directory:
- self.dirHome: user home directories
Data directory:
- self.dirProjects: projects root directory
- self.dirProjectsArchive: this is where the data is going to be archived
- self.dirProjectsCurrent: all projects can be accessed from here
- self.dirPublicDatasets: public data is stored there
- ALMA_ID_checker(ID)[source]
checks if an ID is a valid ALMA ID of the form YYYY.C.IIIII.X with
- YYYY: year
- C: running number for proposal deadlines this year
- IIIII: ID
- X: proposal type
- aID_of_cwd()[source]
if you are in an arbitrary directory, run this command to get the allegro ID of the project you are currently in
- activate_visitor_account(mail=True)[source]
Activates the next free Allegro visitor account. This method calls the terminal command
$ allegro-add-user
which is a script that provides the necessary super-user permissions to activate the new account.
Parameters: mail (bool) – Send out an email to the user
- add_f2f(name=None, affiliation=None, host=None, ticket=None, date=None, duration=None, questionnaire=None, comment=None)[source]
Adds a face-to-face visit to the database
Parameters: - name (str) – visitor name
- affiliation (str) – visitor affiliation
- host (str) – Allegro host
- ticket (str) – Helpdesk ticket ID
- date (str) – date (format: YYYY/MM/DD)
- duration (int) – duration in days (everything above 5 will default to 5+, 0 should be used if it’s not clear, e.g., in the case of ongoing in-house collaboration)
- questionnaire (bool) – 2-element array indicating if the [visitor, host] questionnaire has been filed
- comment (str) – Comment about the nature and success of the visit
Adds an email to the Allegro newsletter list
Params str email: email (can also be a list)
- change_state(state=None)[source]
changes the state of the currently buffered project. Possible states are:
- 0 - Project created
- 1 - SB preparation in progress
- 2 - SB approved
- 3 - Data partially delivered
- 4 - Data fully delivered
Parameters: state (int) – new state
- check_activity()[source]
checks the last date a file in this project has been accessed
Returns: datetime object with last access
- check_message(message, boolean=True, fail_message='Failed', success_message='OK')[source]
check message with OK and Failed
Parameters:
- create_project(category=None, almaID=None, PI=None, CS=None)[source]
Creates a new project directory with all subdirectories and links.
Parameters: The script will then
- create the directory structure in /lustre/allegro/data/projects
- create a softlink in the Allegro directory
- inlcude project into database
- data_backup(user=None)[source]
backs up data in the currently loaded project
Parameters: user (str) – is username is given, only the directory projectID/analysis/username is backed up. This function performs the following steps:
find all files that match the rsync filter self.rsync
- copy these files into the archive directory, which consists of the
project ID and the current date, through rsync.
- deactivate_visitor_account(mail=True, backup=True)[source]
Deactivates the currently loaded visitor account.
Parameters: mail (bool) – Send out an email to the user
- headline(title)[source]
prints a headline with ‘=’* and the title in it
Parameters: title (str) – title
- link_public_dataset(ID=None, unlink=False)[source]
links data from the public data directory into the archive directory of a project
Parameters: Warning
When unlinking, the listOfPublicDatasets is reduced to the datasets that are linked to the project. Therefore, the indices are different from the self.listOfPublicDatasets
- link_user(user=None, mail=True)[source]
Adds a user to the currently loaded project.
Parameters: With this information, the script then does the following steps:
- create a user home-directory in home/username (if it doesn’t already exist)
- create a user-directory in projectID/analysis
- set a link into the user home-directory
- update the database
- send a welcome message to the user (optional)
- list_f2f(ID=None, current=False)[source]
lists the face-to-face visits to Allegro
Parameters: - ID (str or int) – displays more information on this particular project. ID can be the IDth element of the listOfF2F, or the f2fID itself
- current (bool) – list extensive summary of the current face-to-face visit
list the current list of newsletter subscribers
- list_projects(ID=None, archive=False, current=False)[source]
lists all projects and a short summary. Optionally, when giving an ID, a full summary of that project is displayed.
Parameters:
- list_qa2(ID=None, current=False)[source]
lists the QA2 work that is done at Allegro
Parameters: - ID (str or int) – displays more information on this particular project. ID can be the IDth element of the listOfF2F, or the f2fID itself
- current (bool) – list extensive summary of the currently loaded QA2
- load_f2f(ID=None, unset=False)[source]
loads a face-to-face visit
Parameters: - ID (str or int) – face-to-face ID (string or index from listOfF2F)
- unset (bool) – remove face-to-face visit from buffer
loads a public dataset
Parameters: - ID (str or int) – newsletter subscriber (str or index of listOfPublicDatasets)
- unset (bool) – remove currently loaded newsletter subscriber from buffer
- load_public_dataset(ID=None, unset=False)[source]
loads a public dataset
Parameters: - ID (str or int) – public dataset ID (str or index of listOfPublicDatasets)
- unset (bool) – remove currently loaded public dataset from buffer
- load_qa2(ID=None, unset=False)[source]
load a qa2 project
Parameters: - ID (str or int) – qa2 ID (string or index from listOfQA2)
- unset (bool) – remove face-to-face visit from buffer
- load_user(ID=None, unset=False)[source]
loads a user
Parameters: - ID (str or int) – user ID (string or index from listOfVisitors)
- unset (bool) – remove visitor from buffer
- load_visitor(ID=None, unset=False)[source]
loads a visitor
Parameters: - ID (str or int) – visitor ID (string or index from listOfVisitors)
- unset (bool) – remove visitor from buffer
- modify_tickets(ticket=None)[source]
modifies the ticket IDs for the helpdesk and the JIRA tickets of the currently loaded project
Parameters: ticket (str or int) – 3-element list with ticket IDs for helpdesk, SB and QA2 tickets
- modify_visitor_expiration_date(date=None, mail=True)[source]
modifies the expiration date of the currently loaded visitor account. This calls the sudo script “allegro-reset-expiration num date”, which has the command line arguments “num”, which is the number of the allegro account (e.g., “1” for “allegro1”) and “date”, which is the new expiration date.
Parameters: date (str) – new expiration date (must be of form YYYY-MM-DD)
- print_to_console(message, newline=True)[source]
prints a message to the console. Default printing option
- query_for_list_element(table, value=None, index=False, title='value')[source]
queries for a valid ID in string format. The input from the query can either be an integer or a string. The return value will always be the list element
Parameters: Example:
>>> table = ['val1', 'val2', 'val3']
>>> parameter = query_for_list_element(table, title="parameter")
 ID    parameter
==========================
[ 0]  val1
[ 1]  val2
[ 2]  val3
    ID or parameter: 2
>>> parameter
'val3'

>>> parameter = query_for_list_element(table, title="parameter")
 ID    parameter
==========================
[ 0]  val1
[ 1]  val2
[ 2]  val3
    ID or parameter: val2
>>> parameter
'val2'

>>> parameter = query_for_list_element(table, value=0, title="parameter")
>>> parameter
'val2'

>>> parameter = query_for_list_element(table, value=-1, title="parameter")
>>> parameter
'val2'
- random_string_generator(length=8)[source]
random alphanumeric string generator
Parameters: length (int) – string length
removes the currently loaded newsletter subscriber from the list
- remove_project(backup=None, force=False)[source]
Remove a project.
Parameters: The following steps are performed:
- unlink all users
- remove the data
- remove the softlink in the alma directory
- remove database entry
- symlink_pair(directory)[source]
returns a dictionary with the symlink pairs in a certain directory
Parameters: directory (str) – directory to search for symlinks
- unlink_user(user=None, backup=None, no_batch=True)[source]
Removes a user from the currently loaded project
Parameters: - user (str) – username to remove
- backup (boolean) – perform backup?
- no_batch (boolean) – print headline?
The script performs the following steps:
- run backup (if selected)
- remove user directory from projectID/analysis
- remove softlink in user home directory
- update database
Writes out the current listOfNewsletter to the newsletter subscription database
QA2
- allegroUtils.qa2.calibrator_summary(vis, data='data')[source]
amp/phase vs. time for all calibrators and amp/phase vs. channel for bandpass for all spectral windows
Parameters:
- allegroUtils.qa2.chanWidth_to_velocity(vis)[source]
converts channel width to velocities
Parameters: vis (str) – measurement set
- allegroUtils.qa2.ds9_region(vis, reg, field=None, color='white', fieldID=False, spw=0)[source]
writes out the pointings into a ds9 region file
Parameters:
- allegroUtils.qa2.flag_to_fitspw(vis, flags, rep=1)[source]
This function inverts flags so that they can be used as input for fitspw in uvcontsub.
Parameters: Returns: two strings, one for flag and fitspw
Examples:
You work on a measurement set with 4 spectral windows and 128 channels each. You want to flag channels 40 to 80 in spw 2? You can specify the flags in two ways:
>>> flag = '2:40~80'
>>> flag = ['','','40~80','']
These are absolutely equivalent.
>>> spw, fitspw = flag_to_fitspw('myvis.ms', ['','','40~80',''])
>>> spw
'2:40~80'
>>> fitspw
'0,1,2:0~39;80~119,3'
If you use the rep keyword, it repeats this sequence.
>>> spw, fitspw = flag_to_fitspw('myvis.ms', ['','','40~80',''], rep=2)
>>> spw
'2:40~80,5:40~80'
This is particularly useful if you have two or more concatenated datasets, where the sequence of spectral windows is repeated.
- allegroUtils.qa2.fluxscale(filenames=None, sb=True, database=True, frequency=None, date='')[source]
Plots the flux densities that were derived in the EB
Parameters: - filenames (str) – filename(s) of the fluxscale files to analyse. If None, the script will automatically search for fluxscale files. This can also be a list
- sb (boolean) – if the script searches for fluxscale-files, also include flux density scales from other EBs? for that, not only the local directory is searched for files with *.fluxscale, but ../X*/*.fluxscale are mapped
- frequency (float) – frequency in Hz for the database search (if None, the mean frequency of the spws in the fluxscale files is taken)
- database (boolean) – query the flux density database through aU.getALMAFlux
- date (str) – query around date (if ‘’, the database will try to find a MS and extract the date from there, otherwise it defaults to today)
- allegroUtils.qa2.get_obs_mode(mode)[source]
returns a key for observing mode and the colour to plot (helper function for listobs)
Parameters: mode (str) – observing mode Returns: short key for observing mode and color in hex-format Return type: str
- allegroUtils.qa2.html_close(f)[source]
finishes the html file and closes the instance f
Parameters: f (file) – html-file object
- allegroUtils.qa2.html_open(filename, title=None)[source]
creates the header of an html file. It returns an instance of the open file that has to be passed on to other procedures, and eventually be closed with html_close().
Parameters: Returns: instance that contains the open file
Return type: file
- allegroUtils.qa2.html_table_close(f)[source]
closes the table
Parameters: f (file) – html-file object
- allegroUtils.qa2.html_table_open(f)[source]
writes the table tag
Parameters: f (file) – html-file object
- allegroUtils.qa2.html_table_row(f, items, header=False, style=None, trstyle=None)[source]
writes table table row
Parameters:
- allegroUtils.qa2.img_rms(imagename, blc=None, trc=None, full=False)[source]
checks the rms in a box as a function of channels in the image to deliver. Currently, this function assumes that the axis are
- 0 - Direction 1
- 1 - Direction 2
- 2 - Polarisation
- 3 - Spectral
Parameters: - imagename (str) – CASA image
- blc (float) – 2D array with the pixel coordinates of the bottom left corner of the box (defaults to the bottom left corner of the image)
- trc (float) – 2D array with the pixel coordiantes of the top right corner of the rms box (defaults to the top right corner of the image)
- full (bool) – return velocity,frequency,rms,maximum rather than only rms
- allegroUtils.qa2.listobs(vis, html=None, directory='html')[source]
creates a html-file that contains an extensive summary of the measurement set.
This page will contain:
- Scan Summary: id, target, time, duration, intent (including a plot of
elevation vs. amplitude)
Fields: id, name, position, intents
- Spectral Windows: id, name, # of channels, resolution (GHz, km/s),
frequency, bandwidth, intent (including a plot of the frequency coverage of the science spectral windows)
- Antenna: id, name, station, position, baseline (including a plot of
the antenna positions)
PWV: plot of the PWV vs. time
Distances: table of angular distances to each source
Parameters:
- allegroUtils.qa2.plotms_summary(vis, data='data', spw='', field='', plot_time=True, plot_channel=False, interactive=False)[source]
This function plots:
- amplitude/phase vs. time: Averaged over all channels, iterated
over spectral windows
- amplitude/phase vs. channel: Averaged over time, iterated over
fields and spectral windows
Parameters: - vis (str) – measurement set
- data (str) – column to plot (‘data’, ‘corrected_data’, ‘model’)
- spw (str) – spectral windows to plot (defaults to all)
- field (str) – fields to plot (defaults to all)
- plot_time (boolean) – plot amp/phase vs. time
- plot_channel (boolean) – plot amp/phase vs. channel
- interactive (boolean) – open the plotms window before the first plot to adjust the picture size?
Messaging
- allegroUtils.messaging.email(sender='alma@strw.leidenuniv.nl', to=None, cc=None, bcc=None, attachment=None, subject=None, message=None)[source]
sends a mail through the terminal command “mail”
Parameters: - from (str) – sender (usually defaults to the current user)
- to (str) – recipient - can be a list
- cc (str) – recipient (CC) - can be a list
- bcc (str) – recipient (BCC) - can be a list
- attachment (str) – attachment files - can be a list
- subject (str) – subject
- message (str) – message file / message string
- allegroUtils.messaging.message_templates(kind=None, info={})[source]
returns pre-defined messages
Parameters: - kind (str) – kind of message. To see a list of all template messages, call the function without any keyword (or set kind=None)
- info (dict) – add-ons that are passed to the default strings to replace certain keywords (must be a dictionary). If info is an empty dictionary, the text template without replacements is returned. If info is not empty, all necessary keywords have to be provided.
time Conversion
Useful functions to convert between times in various reference frames.
- allegroUtils.timeConversion.mjd_to_unix(t, seconds=False)[source]
converts Modified Julian Date (MJD) to a unix timestamp.
Parameters: Returns: Unix timestamp (in seconds)
Generally, the CASA output is MJD in seconds.
>>> from datetime import datetime
>>> t_unix = mjd_to_unix(4.9144e9, seconds=True)
>>> t_unix
1407683199.9999998
>>> datetime.fromtimestamp(t_unix)
datetime.datetime(2014, 8, 10, 17, 6, 40)
- allegroUtils.timeConversion.unix_to_string(t, format='%Y/%m/%d/%H:%M:%S')[source]
converts a unix time to formatted string (assumes UTC)
Parameters: - t – UNIX timestamp (in seconds)
- type – float
- format – String output format
- type – string
Returns: string represenation of the time
>>> from datetime import datetime
>>> t_unix = mjd_to_unix(4.9144e9, seconds=True)
>>> t_unix
1407683199.9999998
>>> unix_to_string(t_unix)
'2014/08/10/15:06:40'
>>> unix_to_string(t_unix, format='%D')
'08/10/14'
WVR
WVR
allegroUtils.wvr
A set of routines to help analyze WVR solutions.
June 2016: v0.9 - LM more custom code for WVR scaling minimisation and searches to select data
JAN: v0.8 - LM more integration and adjustments
JUNE-SEP: v0.7 - LM added much more functionality for phase unwrapping options
14Jan15 : v0.6 - LM integrated functions generated for the project
09sep14 : v0.5 - TvK integrated functionality written during EOC weeks and update of role within the allegroUtils package
14may14 : 0.4 - TvK - Adapted the sqlite interface to work with information on the source
09may14 : 0.3 - MS - Included the wvr-tools into the allegroUtils-package and put it under version control. Some functions (antennaENU, stokes, getband) have been moved to “casacore” bundle, another one (rms) to the “core” bundle.
25mar14 : 0.2 - TvK - Started from v0.1 and removed functions. Added Comments, removed old functions.
01feb14 : 0.1 - MS - Initial build. The initial bundle of scripts by Sarah Graves (U Cambridge) contained the following functions:
- WVRcheck
- WVRcalib
- asdm_importToCASA
- asdm_getCalibScans
- getLastSpwID
These functions were updated/modified and their functionality enhanced. The wrappers to extract the information for our datasets were put in place, which are
- generate_files (imports the ASDM, applies the WVR and puts out fits files with all kinds of information)
- plot_allan (plots all kinds of things on a per-baseline/antenna basis)
Additional functions were included
- irrAllanVariance - a speed-up version of irrAllanVariance2 (from TvK), which can calculate the Allan Variance for samples with time gaps
- phaseUnwrap - unwraps the phase by smoothing the data in a polar plot. This is useful if the data is quite noisy
allegroUtils.wvr.wvr contains the following functions:
- get_bldir - get Baseline direction/angle
- asdm_importToCASA - import an asdm. Can be used to import only the calibration.
- asdm_getCalibScans - Identify calibration scans
- phaseUnwrap - Function to unwrap phase
- getLastSpwID - Get Last spectral window ID. Guaranteed to be science
- getLastSpwID_ms - New method works correctly not just ‘guess’ checks ave and is a wideband
- getrms - Returns the rms of a data array
- noisecolor - artificial noise generator
- randomwalk -
- wrapCheckTime - After running the phaseUnwrap checks for accidental wraps and corrects
- wrapCheckTime2 - After running the phaseUnwrap checks for accidental wraps and corrects deals with nans and gaps
- STD10 - calculates mean of standard deviations calculated on overlapping 10 element samples
- STDC - calculates mean of standard devitaions calculated on a specified overlapping timescale
- MEAN10 - calculates mean of means calculated on overlapping 10 element samples
- getPhase - returns phase series for a baseline from an ms file (data, corrected data or wvr soln)
- getTime - returns time series for the data, or wvr
- getClosure - returns closure phase series
- makeLinear - simple linear fit on a phase (or any) data series with time stamps
- makeUnity - makes a unity (point source) ms file from a data ms file
- toPathLength - change phase to microns path length
- getPolmask - get a list of booleans for polarization mask used in two_point_deviaton_func
- getTime_2pt - getTime but altered for inputs from two_point_deviaton_func only
- getPhase_2pt - getPhase significanlty altered for inputs from two_point_deviaton_func only
- wrapCheckTimeMod - a modified version for testing
- wrapCheckTimeRMS -
- phaseUnwrap2 - uses only the finite values
- outlier_remove - removes outlier in a phase stream according to a sigma cut
- flagger_remove - sets data to nan if it is time be flagged according to its time
- crossCorr - function to do a cross correlation manually
- angSep - calculate the angular separation between 2 sources
- superecho - statement print for MY version only
allegroUtils.wvr.allanvariance contains the following functions
- generate_files - generates the MS and the WVR calibration table
- metadata - returns a dictionary with metadata from a MS
- allan_variance - calculates the allan deviation of a MS or WVR calibration table
- plot_allan - main plotting routine
- AllanVariance - Allan Variance calculator from analysisUtils - returns deviation
- irrAllanVariance - Allan Variance calculator with gaps from MS - inc. normalisation - returns 2-pt deviation
- irrAllanVariance_Hills - Allan Variance calculator with gaps from MS - fixed time estimator - returns 2-pt deviation
- irrAllanVariance_Hills2 - Allan Variance calculator with gaps from MS - overlapping estimator - returns 2-pt deviation
- irrAllanVariance_Hills3 - Allan Variance calculator with gaps from MS - recursively generated time-series from data-series - returns 2-pt deviation
- calc2Pt - Calculates 2-point deviations for times intervals 1 to len(time)/2 for any data series - overlapping, nap-gap resilient
- calc2PtT - Calculates 2-point deviation for a given time interval only for any data series - overlapping, nap-gap resilient
- ratio - calculate ratios
- two_point_deviation - calculated the 2-pt deviations for a full data set, new phase unwrap incorprated (updated variation of allan_variance)
- two_point_deviation_func - as two_point_deviation, but tidied with some functions
- minScaling - to read in the phase data and return the optimised scale value for a TPD timescale
allegroUtils.wvr.wvrtools contains the following functions
- WVRcheck - Check if WVR has been applied or not
- WVRcalib - applies WVR table
- TpwvFromMS - extracts time, elevation and measurement of the WVR stream
- pwvFromTpwv - Calculate the PWV from the WVR stream
- pwvFromMS - Extract measured PWV for each antenna
- plotPWVfromWVR - Plot PWV versus time
allegroUtils.wvr.mysql contains the following functions
- checkentry - check if an entry is already included in the database
- putentry - updates/adds a new entry in the old style database
- putentry2 - updates/adds a new entry in the new style database
allegroUtils.wvr.plottools contains the following functions
- makecoverageplot - makes a plot of coverage (baseline length vs PWV)
- makeratioplot - makes a scatter plot for three quantities.
- TP_base_ave - plots 2-PT deviations for 5 times from the database vs. baseline
allegroUtils.wvr.phaseRef contains the following functions TODO
- phaseReferencing - Basic function to use for multi-source tracks
- allegroUtils.wvr.wvr.MEAN10(phase)[source]
Calc mean over ~10 sec return average
Read phase array and calc rolling mean This is over elements not real time actually but integration time is 0.96s
Parameters: phase (float array) – any unwrapped input phase Returns: Mean for overlapping 10 sec cycles Return type: float
- allegroUtils.wvr.wvr.STD10(phase)[source]
Calc STD over 10 sec return average
Parameters: phase (float array) – any unwrapped input phase Returns: Stanard deviation for independent 10 sec cycles Return type: float Read a phase array which must be unwrapped and have been checked for incorrect jumps (although this should not significantly affect these statistics if jumps are minimal) and calculated the STD in overlapping 10 sec times only for this EOC data with 0.96 integration times. Note this is STANDARD DEVIATION HERE - takes out the mean value. RMS with mean or fit removed SHOULD be the same value for zero centred phase.
- allegroUtils.wvr.wvr.STDC(phase, over)[source]
Calc STD over time and return the average
Parameters: - phase (float array) – any unwrapped input phase
- over (int) – seconds (index actaully) to include in one calc - [limit len(phase)-1]
Returns: Stanard deviation for independent ‘over’ cycles
Return type: float
Read a phase array which must be unwrapped and have been checked for incorrect jumps (although this should not significantly affect the statistic is jumps are minimal) and calculated the STD in overlapping times (user input) only for this EOC data with 0.96 integration times. Note this is STANDARD DEVIATION HERE - takes out the mean value. RMS with mean or fit removed SHOULD be the same value for zero centred phase.
- allegroUtils.wvr.wvr.angSep(alp1, del1, alp2, del2)[source]
This function calculates the angular seperation of sources on the sky using the Vincenty formula, one can enter either RA and dec as alp and del, or the AZ and ALT(Elev) as degrees values.
Parameters: Returns: the angular seperation of the sources in degrees
Return type: float
- allegroUtils.wvr.wvr.asdm_getCalibScans(asdm, intent=None, field=None, combine='AND')[source]
Finds the scans by intent
Parameters: Returns: string with scans
Return type: str
- allegroUtils.wvr.wvr.asdm_importToCASA(asdm, vis=None, intent='BANDPASS', verbose=False, scans_use=False)[source]
Imports the ASDM into CASA. This function es, which scans to include in the ms from the asdm and then import only those scans. Finally, select a single correlation to import.
Parameters: Typew scans_use: string
Returns: True if import succeeded
Return type: boolean
- allegroUtils.wvr.wvr.crossCorr(phase1, phase2, timein)[source]
Reads in two phase (or any match array) data sets and undertakes the cross correlation - this is own code but should be same as the np.correlate command - but doesnt use zero padding and also normalises to 1 max
Parameters: - phase1 (float array) – array of phase values from a baseline
- phase2 – array of phase vlaues from a baseline
- timein (array same length as phase1 and phase2) – array of time values to sort into regular array
Returns: the cross correlation value and timescale
Return type: float array (2D)
- allegroUtils.wvr.wvr.flagger_remove(phase, times, flag_out='')[source]
this reads in either a single phase array or more complex data structure such as the raw phase we read from EOC data, i.e. both pols
Parameters: - phases (float array) – array single or complex
- times (float array) – array of the time data, zero from start
- flag_out – string of times, format ‘1400~1500,1600~1700’, will select times between 1400 and 1500 to flag and between 1600 and 1700 to flag.
Returns: the phases in same format as the input but with outliers as nans - i.e wont plot or be used in unwraps later
Return type: float array
- allegroUtils.wvr.wvr.getClosure(vis, ant1, ant2, ant3, data='DATA', flag=False)[source]
function to read in 3 antennas, extract the phases and calculate the closure phase for the triangle of antennas. Must be given in order, ie 0 1 2 not 2 0 1
Parameters: Returns: array of closure phases
Return type: float array
- allegroUtils.wvr.wvr.getLastSpwID(vis)[source]
Find which is the second last spw. This one is pretty much guaranteed to have science data in it. in getSpwIDBaseBand0() there may be some Band6 pointing spws that are getting in the way
Parameters: vis (string) – measurement set Returns: ID of the last channel-averaged spectral window Return type: int
- allegroUtils.wvr.wvr.getLastSpwID_ms(vis)[source]
Find which is the last averaged SPW which is used for scaling
Parameters: vis (string) – measurement set Returns: ID of the last channel-averaged spectral window Return type: int
- allegroUtils.wvr.wvr.getPhase(vis, ant1, ant2, data='DATA', unit='radians', WVR=False, flag=False)[source]
Read and ms file and select the phases from one pol and the averaged channel to use in analysis - optionally can flag to nan where ms flags are present
Parameters: - vis (string) – measurement set
- ant1 (int) – antenna 1 in array
- ant2 (int) – antenna 2 in array
- data (string) – data type to extract (DEFAULT = DATA)
- unit (string) – unit to return phase in (DEFAULT radians - compatible with other funcs)
- WVR (bool) – to read wvr dat syntax is different, will return 2 antenna phase solns no flags and reads the wvr.gcal file, not the ms data file
- flag (bool) – flag data accoring to stored flags in ms
Returns: the phases of a baseline or antenna
Return type: float array
- allegroUtils.wvr.wvr.getPhase_2pt(query, data, polmask, WVR, pols)[source]
Section of 2-pt calculation to get the polarization averaged phases
Parameters: Returns: the phases of baseline or ant dependent on input query
Return type: float array
- allegroUtils.wvr.wvr.getPolmask(meta)[source]
Read meta data and return the polarization strings
Parameters: meta (dictionary) – measurement set Returns: list of boolean values for mask Return type: bool list
- allegroUtils.wvr.wvr.getTime(vis, ant1=0, ant2=1, WVR=False, spwnum=None, noZero=False)[source]
Read an ms file and return to zero starting time in seconds - note these are the recored times so there are gaps due to sub scans etc
Parameters: - vis (string) – the measurement set
- ant1 (int (DEFAULT = 0)) – antenna 1 to use
- ant2 (int (DEFAULT = 1)) – antenna 2 to use
- WVR (bool) – if the time is needed for WVR soln, note uses wvr.gcal type soln tables
- spwnum (integer) – the spw if you want to specify as integer
- noZero (boolean) – if you want the times out in full format - not set to zero start
Returns: the time stamps for the observations
Return type: float array
- allegroUtils.wvr.wvr.getTime_2pt(vis, ant1=0, ant2=1, WVR=False, spwnum=None)[source]
Read an ms file and return to zero starting time in seconds - note these are the recored times so there are gaps due to sub scans etc
Parameters: Returns time: the time for the observations
Return type: float array
- allegroUtils.wvr.wvr.get_bldir(antennadata, baselines)[source]
calculates the azimuth of a baseline w.r.t. north.
Parameters: - antennadata – Dictionary with x/y positions of antennas
- baselines (string) – list with baselines
Returns: list with angles
- allegroUtils.wvr.wvr.getrms(data, polyorder=3)[source]
Returns the rms of a data array after subtracting a general trend, which is modelled by a polynomial
Parameters: Returns: dictionary with rms for original and corrected phase rms
Return type: dict
- allegroUtils.wvr.wvr.makeLinear(phase, time)[source]
Do a linear fit on the phase and then flatten, specifically for only testing the 2-pt variance calcs before and after to see what time scale effected - uses scipy linearregression
Parameters: - phase (float/double array) – the unwrapped phase any unit
- time (float/dobule array) – the time in any unit
Returns: corrected phase offset to zero start
Return type: float array
- allegroUtils.wvr.wvr.makeUnity(vis, visout)[source]
to read an ms file and create and output unity file
Parameters:
- allegroUtils.wvr.wvr.noise_color(beta, size=1000)[source]
generate various noise features follwoing P(f)=1/f^beta typical values beta = 0 - Gaussian white noise (NOT equal to uniform white) beta = 1 - pink noise beta = 2 - brownian (red) noise
resulting values are between 0 and 1
Parameters: Returns: two 1D arrays with the phases and times
Return type: float,float
- allegroUtils.wvr.wvr.outlier_remove(phases, factor=3.0)[source]
this reads in either a single phase array or more complex data structure such as the raw phase we read from EOC data, i.e. both pols
Parameters: - phases (float array) – array single or complex
- factor (float) – multiples of the standard deviation the mean and data differ by, default = 3.0
Returns: the phases in same format as the input but with outliers as nans - i.e wont plot or be used in unwraps later
Return type: float array
- allegroUtils.wvr.wvr.phaseUnwrap(phase, time=None, width=5)[source]
Unwraps the phases through averaging
Parameters: - phase (float array) – phase in radians
- time (float array) – time
- width (float) – convolution kernel width
Returns: unwrapped phase-array
Return type: float array
If no time array is given, the phase is simply unwrapped by identifying phase jumps by more than 180deg. That can be quite tricky for noisy data.
For this, the averaging algorithm is introducing. When giving a time-array plus a convolution-kernel width, the time-phase-array is converted into polar coordinates r-phi. These coordinates are averaged to find the general trend, and to see the points where the phase goes beyond [-180, 180], which have to be unwrapped.
- allegroUtils.wvr.wvr.phaseUnwrap2(phase, time=None, factor=1.0)[source]
Unwraps the phases
Parameters: - phase (float array) – phase in radians
- time (float array) – time
Returns: unwrapped phase-array
Return type: float array
If no time array is given, the phase is simply unwrapped by identifying phase jumps by more than 180deg. That can be quite tricky for noisy data - historic but retained - not used.
Modified version where 1) factor can be used to specify wraps (multiples of pi) 2) nans are dealt with correctly
Note is slower, 65 ms vs 200 us
- allegroUtils.wvr.wvr.randomwalk(size=1000, step=1.0)[source]
random walk generator, numbers between 0 and 1 :param size: size of array returned :type size: int :param step: Step size of random walk :type step: float
- allegroUtils.wvr.wvr.superecho()[source]
this just returns the line with echo test that my version actually is commanded so I can make edits here
- allegroUtils.wvr.wvr.toPathlength(freq, phase, radians=True, verbose=True)[source]
To read in the rest frequency and the allan variance values (or any type of phase) and to convert these into a standard path length in microns. Options for radians or degrees input default is radians
Includes a crude check to see if frequency is in GHz or not
Parameters: Returns: convesion to microns the path length from phase
Return type: float array
- allegroUtils.wvr.wvr.wrapCheckTime(phase, time, lim=90, over=20, std_val=3.5, auto=False)[source]
Check the phase for incorrect wraps
Parameters: - phase (float array) – phase in radians
- time (float array) – the time samples
- lim (float) – limit for consecutive phases to vary by (180 - lim)
- over (integer) – number of elements to use for SD calc
- std_val (float) – value the phase SD must be above to confirm a jump
- auto (boolean) – to calculate the SD automatically
Returns: phases after check - corrected
Return type: float array
If no limit is set the default of 90 degrees is used to find possible jumps, i.e. incorrect wraps are found if the phase is 180 deg (pi) - lim = 90 deg. Given the phase should have been unwrapped there should not be large differences between the consecutive phase points. Time checks are also performed as phase differences over a scan gap can mean incorrect wraps added back if large lim values are used, i.e. to detect jumps ~ 120 deg in size
The limit sets the sensitivity to detect the jump. Larger lim value means more jumps found, i.e lots of consecutive phases vary by 180 - lim, which is small. To check then we make sure the jump is not over a time gap then check that the rolling means over/2 before and after the are different by the 2 x the nominal standard deviation x std_val (input). This acts as the robustness to ensure the jump found is real or not. To be robust to the places where phases are noisy in a row the rolling means are shifted when a jump is correctly found, such that a subsequent jump close in time checks the adjusted means which, would be aligned if only one jump is real and rest were noise (for clustered points).
Note, limitation is the before rms is used if enough elements to do so, otherwise uses the starting phase values
- allegroUtils.wvr.wvr.wrapCheckTime2(phase, time, lim=90, over=20, std_val=3.5, auto=False)[source]
Check the phase for incorrect wraps - deals with nans, removes and concatinates, returns original lenght array and replaces nans after wrap checking
Parameters: - phase (float array) – phase in radians
- time (float array) – the time samples
- lim (float) – limit for consecutive phases to vary by (180 - lim)
- over (integer) – number of elements to use for SD calc
- std_val (float) – value the phase SD must be above to confirm a jump
- auto (boolean) – to calculate the SD automatically
Returns: phases after check - corrected
Return type: float array
If no limit is set the default of 90 degrees is used to find possible jumps, i.e. incorrect wraps are found if the phase is 180 deg (pi) - lim = 90 deg. Given the phase should have been unwrapped there should not be large differences between the consecutive phase points. Time checks are also performed as phase differences over a scan gap can mean incorrect wraps added back if large lim values are used, i.e. to detect jumps ~ 120 deg in size
The limit sets the sensitivity to detect the jump. Larger lim value means more jumps found, i.e lots of consecutive phases vary by 180 - lim, which is small. To check then we make sure the jump is not over a time gap then check that the rolling means over/2 before and after the are different by the 2 x the nominal standard deviation x std_val (input). This acts as the robustness to ensure the jump found is real or not. To be robust to the places where phases are noisy in a row the rolling means are shifted when a jump is correctly found, such that a subsequent jump close in time checks the adjusted means which, would be aligned if only one jump is real and rest were noise (for clustered points).
Note, limitation is the before rms is used if enough elements to do so, otherwise uses the starting phase values
- allegroUtils.wvr.wvr.wrapCheckTimeMod(phase, time, lim=90, over=30, std_val=3.5, auto=False)[source]
Check the phase for incorrect wraps
Parameters: - phase (float array) – phase in radians
- time (float array) – the time samples
- lim (float) – limit for consecutive phases to vary by (180 - lim)
- over (integer) – number of elements to use for SD calc
- std_val (float) – value the phase SD must be above to confirm a jump
- auto (boolean) – to calculate the SD automatically
Returns: phases after check - corrected
Return type: float array
If no limit is set the default of 90 degrees is used to find possible jumps, i.e. incorrect wraps are found if the phase is 180 deg (pi) - lim = 90 deg. Given the phase should have been unwrapped there should not be large differences between the consecutive phase points. Time checks are also performed as phase differences over a scan gap can mean incorrect wraps added back if large lim values are used, i.e. to detect jumps ~ 120 deg in size
The limit sets the sensitivity to detect the jump. Larger lim value means more jumps found, i.e lots of consecutive phases vary by 180 - lim, which is small. To check then we make sure the jump is not over a time gap then check that the rolling means over/2 before and after the are different by the 2 x the nominal standard deviation x std_val (input). This acts as the robustness to ensure the jump found is real or not. To be robust to the places where phases are noisy in a row the rolling means are shifted when a jump is correctly found, such that a subsequent jump close in time checks the adjusted means which, would be aligned if only one jump is real and rest were noise (for clustered points).
Note, limitation is the before rms is used if enough elemnts to do so, otherwise uses the starting phase values
- allegroUtils.wvr.wvr.wrapCheckTimeRMS(phase, time, lim=90, over=60, std_val=3.5, auto=False, rapid=False)[source]
Check the phase for incorrect wraps
Parameters: - phase (float array) – phase in radians
- time (float array) – the time samples
- lim (float) – limit for consecutive phases to vary by (180 - lim)
- over (integer) – number of elements to use for SD calc
- std_val (float) – value the phase SD must be above to confirm a jump
- auto (boolean) – to calculate the limit automatically based on the data SD over 60 seconds
- rapid (boolean) – compensates for rapidly fluctuating data - jump set as 30
Returns: phases after check - corrected
Return type: float array
If no limit is set the default of 90 degrees is used to find possible jumps, i.e. incorrect wraps are found if the phase is 180 deg (pi) - lim = 90 deg. Given the phase should have been unwrapped there should not be large differences between the consecutive phase points. Time checks are also performed as phase differences over a scan gap can mean incorrect wraps added back if large lim values are used, i.e. to detect jumps ~ 120 deg in size
The limit sets the sensitivity to detect the jump. Larger lim value means more jumps found, i.e lots of consecutive phases vary by 180 - lim, which is small. To check then we make sure the jump is not over a time gap then check that the rolling means over/2 before and after the are different by the 2 x the nominal standard deviation x std_val (input). This acts as the robustness to ensure the jump found is real or not. To be robust to the places where phases are noisy in a row the rolling means are shifted when a jump is correctly found, such that a subsequent jump close in time checks the adjusted means which, would be aligned if only one jump is real and rest were noise (for clustered points).
Note, limitation is the before rms is used if enough elements to do so, otherwise uses the starting phase values. Also has option rapid, this means if you see rapid changes in the phases sometimes over the gaps it will think there is a jump, i.e. more than 1.3 * pi in a 60 sec gap. If you use option rapid, then it compares the same jump but over 30 seconds, only if jump is larger than 1.3 * pi over a 30 sec gap in the 60 second averaged data does it perform a wrap correction
Allan Variance
- allegroUtils.wvr.allanvariance.AllanVariance(phase, time, ref_freq)[source]
Returns the Allan Deviation of irregularly time-sampled distribution.
This algorithm uses
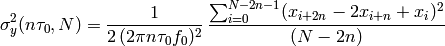
similar to the time-series algorithm with overlapping. The normalisation factor comes from Allan’s original definition of the Allan variance
This algorithm does not resample an irregularly sampled time-series onto a regular grid, but assumes that all phase measurements
 are taken in equal timesteps.
To account for time-gaps, use irrAllanVariance().
are taken in equal timesteps.
To account for time-gaps, use irrAllanVariance().Note that this function returns the Allan Deviation rather than the Allan Variance. This originates in the Allan Variance function that was originally defined in the analysisUtils, and might change in later releases of the allegroUtils.
Parameters:
- allegroUtils.wvr.allanvariance.allan_variance(dataset, prefix=None, timerange=None, meta=None, spw=None, unwrapwidth=None, verbose=True, algorithm='Hills3')[source]
Analyse the data products and generates fits tables with the Allan Deviation for each dataset.
Parameters: - dataset (str) – input filename
- prefix (str) – prefix for the output filenames
- timerange (float) – timerange is a list [t_min, t_max], where t_min/t_max are the time since the start of the observations
- meta (dict) – dictionary with metadata (see the metadata function)
- spw (str) – spectral window to analyse (default: last chan-averaged spw)
- unwrapwidth (float) – unwrap the phases through the averaging method with a kernel of this width
- verbose (boolean) – verbose?
- algorithm (str) – algorithm to calculate the Allan Deviation
Returns: If no file prefix is given, the routine returns a dictionary with the Allan Deviation
Return type: dict
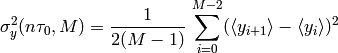
- allegroUtils.wvr.allanvariance.calc2Pt(ph, time, npts=10.0)[source]
LTM version of the 2pt deviation calculation
Parameters: - phase (float/double array) – the unwrapped phases (any unit)
- time (float/double array) – the time as read from the ms
- npts (float) – The algorithm will resample the timescales, and return not more than npts points per order of magnitude.
Returns: 2-dim array with timescales and 2 point deviation
Matches the Hills2 code by MS, but is a bit faster and still deals with gaps. Not as fast as Hills3 but no gap issues or interpolation problems. This gives a specific 2-pt deviation for a selected time interval only. Not a series of 2-pt values.
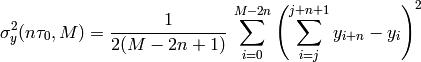
- allegroUtils.wvr.allanvariance.calc2PtT(ph, time, interval)[source]
LTM version of the 2pt deviation calculation
Parameters: - phase (float/double array) – the unwrapped phases (any unit)
- time (float/double array) – the time as read from the ms
- interval (int) – time to cal 2pts over in units of tau (0.96 sec)
Returns: 2-dim array with a single timescale and 2 point deviation value
Matches the Hills2 code by MS, but is a bit faster and still deals with gaps. Not as fast as Hills3 but no gap issues or interpolation problems. This gives a specific 2-pt deviation for a selected time interval only. Not a series of 2-pt values.
- allegroUtils.wvr.allanvariance.calc_ratio(data)[source]
Calculate the ratio of the baselines Time cuts are : < 20 seconds 20 - 80 seconds 80+ seconds
- allegroUtils.wvr.allanvariance.generate_files(asdm, verbose=True, overwrite=False, intent=None, outputdir=None, scans_use=False)[source]
Generates all the files for the WVR analysis, namely: * measurement set (asdm.ms) * measurement set with no data (asdm.unity.ms) * wvr calibration table (asdm.wvr)
Parameters:
- allegroUtils.wvr.allanvariance.getWVRScaleFactor(vis_run='', refant='', badant='', badbl='', toplot='ref', overwrite=False, verbose=False, ratio=True, ratio_time=6.0)[source]
This code reads the fits files created for a dataset (one source) that has been processed in Allegro routines and compares a range of scaling factors for the WVR solution and makes a plot of the output
Parameters: - vis_run (string) – the visibility dataset to read from - prefix WITHOUT .vis.fits extension (eg. uid___A002_Xad5116_X5dd)
- refant (string) – reference antenna - no default - must supply
- badant (string) – any bad antennas to flag out, comma separated (eg. ‘DV01,DV02’) - default = ‘’
- badbl (string) – any bad baseline to flag out, comma separated (eg. ‘DV01-DV02’) - default = ‘’
- toplot (string) – comare baselines with the reference antenna (ref) - default - or all baselines (all)
- overwrite (boolean) – overwrite the whole director - default = False
- verbose (boolean) – do you want extened text output? - Default False (minimal text output)
- ratio (boolean) – do you want the improvement ratio plot? - Default = True
- ratio_time (float) – what timescale do you want to scaling factor from and the plot to be shown for improvement - default = 6.0 (seconds)
Returns: List of the scaling factors and timescales
Return type: List Array
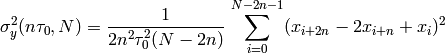
- allegroUtils.wvr.allanvariance.irrAllanVariance(phase, time, ref_freq, tau0=None, width=None)[source]
Returns the Two-Point Deviation (sigma) of any irregularly time-sampled distribution.
This algorithm uses
which is similar to the time-series algorithm with overlapping, including a normalisation factor that originates in Allan’s original definition in AllanVariance().
This algorithm resamples an irregularly sampled time-series onto a regular grid with a timestep of
 .
.Note
that this function returns the Two-Point Deviation rather than the Allan Variance. This originates from the Allan Variance function
that was originally defined in the analysisUtils, and might change in later releases of the allegroUtils.
Parameters: - phase (float) – phase-array
- time (float) – time-array

- ref_freq (float) – reference frequency
 (in Hz)
 - tau0 (float) – timescale to analyse (defaults to the median time-difference between to subsequent timestamps in the time array)
- width (float) – convolution width for the phase unwrapping (see phaseUnwrap())
Return float: 2-dim array with timescales and 2-pt Deviation
- phase (float) – phase-array
- allegroUtils.wvr.allanvariance.irrAllanVariance_Hills(phase, time, ref_freq=1, tau0=None, width=None, unwrap=False)[source]
Returns the Two-Point Deviation (sigma) of any irregularly time-sampled distribution.
This algorithm uses
which is similar to the time-series algorithm with fixed estimator, where the data has been averaged over a timebin of width
 .
.This algorithm resamples an irregularly sampled time-series onto a regular grid with a timestep of
.Note
that this function returns the Two-Point Deviation rather than the Allan Variance. This originates from the Allan Variance function
nomenclature that was originally defined in the analysisUtils, and might change in later releases of the allegroUtils.
Parameters: - phase (float) – phase-array

- time (float) – time-array
- ref_freq (float) – this parameter is obsolete, but is retained for compatibility reasons
- tau0 (float) – timescale to analyse (defaults to the median time-difference between to subsequent timestamps in the time array)
- unwrap (boolean) – unwrap phase array?
- width (float) – convolution width for the phase unwrapping (see phaseUnwrap())
Return float: 2-dim array with timescales and 2-pt Deviation
- phase (float) – phase-array
- allegroUtils.wvr.allanvariance.irrAllanVariance_Hills2(phase, time, ref_freq=1.0, tau0=None, npts=10.0, width=None, unwrap=False)[source]
Returns the Two-point Deviation (sigma) of irregularly time-sampled distribution.
This algorithm uses
the frequency-series algorithm with overlapping.
This algorithm is accurate, even if there are time gaps. Owing to the double summation, it’s up to a factor of 10 slower than irrAllanVariance_Hills3().
This algorithm resamples an irregularly sampled time-series onto a regular grid with a timestep of
.Note
that this function returns the Two-Point Deviation rather than the Allan Variance. This originates from the Allan Variance function
nomenclature that was originally defined in the analysisUtils, and might change in later releases of the allegroUtils.
Parameters: - phase (float) – phase-array
- time (float) – time-array
- ref_freq (float) – this parameter is obsolete, but is retained for consistency with the original Allan Variation algorithm from the analysisUtils
- tau0 (float) – timescale to analyse (defaults to the median time-difference between to subsequent timestamps in the time array)
- npts (float) – The algorithm will resample the timescales, and return not more than npts points per order of magnitude.
- unwrap (boolean) – should unwrapping be performed?
- width (float) – convolution width for the phase unwrapping (see phaseUnwrap())
Return float: 2-dim array with timescales and 2-pt Deviation
- phase (float) – phase-array
- allegroUtils.wvr.allanvariance.irrAllanVariance_Hills3(phase, time, ref_freq=1.0, tau0=None, npts=10.0, unwrap=False, width=None)[source]
Returns the Two-Point Deviation (sigma) of any irregularly time-sampled distribution.
This algorithm uses
the time-series algorithm with overlapping. The time-series is recursively generated from the phase-series, using
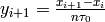 and starting with
  .
.This algorithm is much faster than irrAllanVariance_Hills2(), but you should be aware of the following note:
Note
Owing to the fact that one has to interpolate over time gaps, this algorithm can be error-prone in the presence of non-continuous data, and should be treated with caution.
Note
that this function returns the Two-Point Deviation rather than the Allan Variance. This originates in the Allan Variance function
nomenclature that was originally defined in the analysisUtils, and might change in later releases of the allegroUtils.
Parameters: - phase (float) – phase-array
- time (float) – time-array
- ref_freq (float) – this parameter is obsolete, but is retained for consistency with the original Allan Variation algorithm from the analysisUtils
- tau0 (float) – timescale to analyse (defaults to the median time-difference between to subsequent timestamps in the time array)
- npts (float) – The algorithm will resample the timescales, and return not more than npts points per order of magnitude.
- unwrap (boolean) – should unwrapping be performed?
- width (float) – convolution width for the phase unwrapping (see phaseUnwrap())
Return float: 2-dim array with timescales and 2-pt Deviation
- phase (float) – phase-array
- allegroUtils.wvr.allanvariance.metadata(vis, spw=None, apex_pwv='apex_pwv', timerange=None, verbose=False, antlim=False)[source]
returns a dictionary with metadata from a MS.
Parameters: - vis (str) – measurement set
- spw (str) – spectral window (default: last chan-averaged spw)
- apex_pwv (str) – directory where the pwv-data from APEX is stored
- timerange (float) – array with [t_min, t_max] from the start of the first observation. So, timerange=[300, 600] will analyse the data that has been taken between 5 and 10 minutes after the start of the observations.
- verbose (boolean) – verbose
- antlim (boolean) – limits the antennas to 45 only
Returns: dictionary with metadata
Return type: dict
The returned dictionary includes:
timequery - the timequery for the extraction of MS
date-obs - the time of the start of the observations
band - the ALMA Band
ref_freq - the reference frequency
spw - the spectral window ID of the reference frequency
- ant - dictionary with antenna parameters
- antenna name
- X
- Y
- Z position
- bl - dictionary with baseline parameters
- name
- median baseline length in UV
- baseline length on the ENU plain (m)
- baseline length in E-W direction
- baseline length in N-S direction (up-down is omitted for now)
pol - polarisations
pwv - pwv (mm)
weather - dictionary with weather data
- field - dictionary with field data
- name
- right ascension
- declination
- scan - dictionary with azimuth-elevation info
- scan number
- mean time
- mean altitude
- mean azimuth
- allegroUtils.wvr.allanvariance.minScaling(time_in, ph_in, un_in, wvr_in, tpd, lim_up=False)[source]
The function reads in the phase stream and acts to minimise a scaling factor according to the given timescale of the tpd OR rms values
assumes that there is a smooth minimum such that corse looping is used to narrow down the value
Parameters: - time_in (float array) – the time stream
- ph_in (float array) – the phase stream
- un_in (float array) – the unity file (correction) stream
- wvr_in (float array) – the wvr corrected stream
- tpd (float or string) – the two-point-deviation timescale (or RMS call)
- lim_up (boolean) – Range of scalings to use. False for standard range, True runs to 0-5
Returns: the scale value
Return type: float
- allegroUtils.wvr.allanvariance.plot_allan(results, meta=None, data=None, nplot=4, plot='BOTH', TeX=False, figdir=None, overwrite=True, xlim=None, ylim=None, automargin=True, eps=False, figsize=[5.5999999999999996, 7.5], doPhase=False, badant='')[source]
Dedicated function to plot the Allan Deviation, Phase and the antenna/baseline configuration.
Parameters: - results (dict or str) – dictionary with results (as returned from allan_variance(...) or filename of the binary fitstable (as generated from allan_variance(...)
- meta (dict) – dictionary with metadata (as returned from metadata(...))
- data (dict) – if results is the dictionary with the Allan Deviation, the dictionary with the original phase values can be provided as this variable. If results is a binary fitstable, data is automatically extracted from the file
- nplot (int) – number of antennas/baselines per page
- plot (str) – mainly important for the measurement set. If plot='BOTH', the plots show both the original, the corrected, and the improvement. Other options are 'DATA' or 'CORRECTED_DATA' for a measurement set, or 'CPARAM' for a WVR table.
- TeX (boolean) – use TeX fonts
- figdir (str) – directory where the plots have to be stored (if at all)
- overwrite (boolean) – overwrite existing plots
- xlim (float) – x limits for the Allan Deviation plot
- ylim (float) – y limits for the Allan Deviation plot
- automargin (boolean) – Automatically find x- and y-limits for the dataset (including some margin)
- eps (boolean) – generate also eps-versions of the plot
- figsize (float) – list with the image size (in inches)
- doPhase (boolean) – generates phase-only plots
- badant (string) – choose antennas to ignore in plots
- allegroUtils.wvr.allanvariance.two_point_deviation(dataset, prefix=None, timerange=None, meta=None, spw=None, unwrap=True, verbose=True, algorithm='calc2pt')[source]
Analyse the data products and generates fits tables with the Two-Point Deviation for each dataset.
Parameters: - dataset (str) – input filename
- prefix (str) – prefix for the output filenames - if none, data not returned or saved
- timerange (float) – timerange is a list [t_min, t_max], where t_min/t_max are the time since the start of the observations
- meta (dict) – dictionary with metadata (see the metadata function)
- spw (str) – spectral window to analyse (default: find last chan-averaged spw)
- unwrap (boolean) – unwrap the phases or not
- verbose (boolean) – verbose?
- algorithm (str) – algorithm to calculate the Allan Deviation
Returns: If no file prefix is given then nothing is output
Return type: dict
- allegroUtils.wvr.allanvariance.two_point_deviation_func(dataset, prefix=None, timerange=None, meta=None, spw=None, unwrap=True, verbose=True, algorithm='calc2pt', wvr_outlier=False, single=False, flag_outlier='', lim=90, over=20, std_val=3.5, auto=False, rapid=False, columns=False, antlim=False)[source]
Analyse the data products and generates fits tables with the Two-Point Deviation for each dataset.
Parameters: - dataset (str) – input filename
- prefix (str) – prefix for the output filenames - if none, results not saved or returned
- timerange (float) – timerange is a list [t_min, t_max], where t_min/t_max are the time since the start of the observations
- meta (dict) – dictionary with metadata (see the metadata function)
- spw (str) – spectral window to analyse (default: find last chan-averaged spw that is wide enough) defualt = None
- unwrap (boolean) – unwrap the phases or not
- verbose (boolean) – verbose?
- algorithm (str) – algorithm to calculate the Allan Deviation
- wvr_outlier (boolean) – checks and does some auto flagging based on outliers with STD calculation
- single (boolean) – option to do single unwrap only pi-pi limit with no wrapcheck
- flag_outlier (string) – string with the times to flag out e.g 12~30,40~50
- lim (int) –
- over (int) –
- std_val (int) –
- auto (boolean) – calculates the lim based on the STD of the data
- rapid (boolean) – uses RMS check with 30s average not 60 if data varies rapidly
- columns (boolean) –
- antlim (boolean) – used to limit the antenna loop to only 45 antennas ONLY IF there are more than that in the array (fits max out over 1000 baselines due to table limit)
Returns: If no file prefix is given, nothing is returned
Return type: dict
MySQL
- allegroUtils.wvr.mysql.checkentry(results)[source]
Checks if the MySQL database already contains information on the UID in questions
Parameters: results – UID name Returns: None or string with missing entries Return type: str
- allegroUtils.wvr.mysql.putentry(results)[source]
- OUT OF DATE!!!
- Enters the required values of a reduced asdm into the old style sql databas (compare2.db)
Parameters: results – UID name of the fits file Returns: None Return type: None
- allegroUtils.wvr.mysql.putentry2(results)[source]
Out of Date, use putentry3 Enters the required values of a reduced asdm into the new style sql databas (comparenew.db)
Parameters: results – UID fits file Returns: None Return type: None
- allegroUtils.wvr.mysql.putentry3(results, database_name='', antenna_out='', baseline_out='')[source]
Enters the required values of a reduced asdm into the new style sql databas (comparenew.db) :param results: UID fits file. :param database_name: name of database to connect to and enter stats into. :param antenna_out: list of antennas to be excluded. Separated by a comma. :param baseline_out: list of baselines to exclude. syntax e.g. DV14-DA64,DV12-DA60,... :type results: str :type database_name: str :type antenna_out: str :type baseline_out: str :returns: None :rtype: None
Phase Referencing
- allegroUtils.wvr.phaseRef.phaseReferencing(vis, meta=None, samesource=False, targetField=1, phaseField=0, scansep=1)[source]
Function to apply Phase solution to the data
- Identify which scans/subscans need to be used to calculate the phase solution and which sources are the “target”. if samesource = True, you split up the data on a single quasar
- identify relevant numbers (cycletime, separation)
- Run the gaincal
- Apply the solution.
- Split out the “target scans” and replace the vis with the
samesource – There is not change in source
- For samesource == True: cycletime – (seconds, 360) time between scans of phasescantime – (seconds, 30) time foor phase solution scan.
- For samesource == False: targetField – (id, 1) field used as target phaseField – (id, 0) field used as
Note
Currently, we only replace the MS file. Do we also want to replace the viswvr and wvr files?
Plotting Tools
- allegroUtils.wvr.plottools.TP_base_ave(database, sorter='pwv', limits=[1.99, 4.0], microns=True, bins=40, save_name=False, noplot=False, fitting=False)[source]
Function to select 2-PT deviations from a specified database and plot these vs the baseline. Binning, limits, order and y-axis output can all be specified
Parameters: - database (sqlite3 database .db) – the sqlite3 database to read the 2-PT deviations from
- sorter (string) – database condition specifier to sort and colour data by (DEFAULT = PWV), options are pwv, wind_speed_mean, pressure_mean, rel_humid_mean
- limits (list) – limits with respect to sorter to select data between (DEFAULT = [1.99,4.00]) to work with pwv
- microns (bool) – to plot output in radians (False) or microns (True) (DEFAULT = True)
- bins (int) – binning of the baseline lenghts
- save_name – file name to save the png plot, no file saved as default
- noplot (bool) – option to not plot the figure to screen, only useful if save_file is filled
- allegroUtils.wvr.plottools.makecoverageplot(database, sorter='pwv')[source]
make a plot showing all data points Function of baseline length and PWV. Color shows band
- allegroUtils.wvr.plottools.makeratioplot(xa='bl_length', ya='ratio', cscale='pwv', constraint='pwv', bin=[0.5, 1.0], doXlog=False, doYlog=False, dobin=True)[source]
makes a scatter plot for each band from the entries in the SQL database. xa = Column to be plotted on X-Axis (standard = baseline length) ya = Column to be plotted on Y-Axis (standard = ratio) cscale = colorscale of points (standard = pwv). dobin = make a constraint constraint = identify column to perform cut (standard = pwv) bin = upper and lower limit of constraints (standard = [0.5,1.0]) doXlog/doYlog = make X/Y axis on logscale (standard = False)
WVR Tools
- allegroUtils.wvr.wvrtools.TpwvFromMS(vis, spw=None, antenna=None, time=True)[source]
Extracts the time, elevation, and the measurement of the 4 WVR channels for each antenna from the measurement set and returns a dictionary with the data stored as [4, nint]-numpy arrays.
Parameters: Returns: time, elevation, Tsky
Return type: dict
- allegroUtils.wvr.wvrtools.WVRcalib(vis, wvr, overwrite=False, reverse=False, toff=0.0)[source]
Calculate and apply the WVR table to an ms
Parameters:
- allegroUtils.wvr.wvrtools.WVRcheck(vis)[source]
Check whether wvr calibration has already been applied to the dataset. This is done by checking the log history of the measurement set
Parameters: vis (string) – measurement set Returns: WVR calibration applied? Return type: boolean
- allegroUtils.wvr.wvrtools.imageBPcal(visfile, field='0')[source]
literally a script to image the BP calibrator in a dataset that is field 0, although one can change this. A dirty map, shallow and deep clean are undertaken. Run in own directory as file outputs are default names
Parameters: Returns: 3 images with default naming
- allegroUtils.wvr.wvrtools.plotPWVfromWVR(t, pwv, figfile=None)[source]
Plots the pwv vs. time.
Parameters: Input can be time and pwv as arrays. Optionally, time and pwv can also be dictionaries, where each of the dictionary items is an array with the time,pwv values for a certain antenna.
So it would be possible to plot pwv for both t, pwv and tD, pwvD:
>>> t, pwv
array([0, 1, 2, 3, 4, 5, 6, 7, 8, 9]),
array([ 0.94126768,  0.37091606, -0.20220262, -1.86810555,  0.54127135, -0.06986392,  0.52915721,  1.05361894,  1.48919136,  0.28908486]))
>>> tD, pwdD
({0: array([0, 1, 2, 3, 4, 5, 6, 7, 8, 9]),
  1: array([0, 1, 2, 3, 4, 5, 6, 7, 8, 9])},
{0: array([ 0.94126768,  0.37091606, -0.20220262, -1.86810555,  0.54127135, -0.06986392,  0.52915721,  1.05361894,  1.48919136,  0.28908486]),
 1: array([-0.77326468,  0.75096047,  0.46097048,  0.10453903, -0.18425609,  0.97326987, -1.49004715, -0.38477006, -2.68286378, -0.8755046 ])})
- allegroUtils.wvr.wvrtools.pwvFromMS(vis, spw=None, antenna=None, time=True, zenith=True)[source]
extracts measured pwv from each antenna
Parameters: Returns: time,pwv
Return type: dict
- allegroUtils.wvr.wvrtools.pwvFromTpwv(Tsrc0, site='AOS', zenith=True, elevation=90.0, eta_c=0.97999999999999998, T_loss=275.0)[source]
calculates the PWV from the WVR data in the MS. Optionally, the PWV can be corrected to PWV_zenith, using the elevation and zenith keywords.
Parameters: - Tsrc ([4, nint]-float array) – measurements of the 4 WVR channels with time. Optionally, this can also be a 4-element array for a single timestep.
- site (str) – antenna site (currently only ‘AOS’ or ‘OSF’ are supported)
- zenith (boolean) – correct towards zenith
- elevation (float) – source elevation (in degrees)
- eta_c (float) – sky coupling constant eta_c
- T_loss (float) – sky coupling constant T_loss
Returns: PWV (in mm)
Return type: float array